Italicise Taxonomic Families, Genera, Species, and Subspecies
Source:R/italicise_taxonomy.R
italicise_taxonomy.RdAccording to the binomial nomenclature, the lowest four taxonomic levels (family, genus, species, subspecies) should be printed in italics. This function finds taxonomic names within strings and makes them italic.
Arguments
- string
A character (vector).
- type
Type of conversion of the taxonomic names, either "markdown", "html", "ansi" or "plotmath", see Details.
Value
For "markdown", "html" and "ansi", a character vector. For "plotmath", an expression vector. Both have the same length as string and keep NA values.
Details
This function finds the taxonomic names and makes them italic based on the microorganisms data set. Family and genus names are italicised anywhere in the text. Species and subspecies names are only italicised when they follow a genus, an abbreviated genus (such as "E." in "E. coli"), or another species or subspecies name, so that ordinary words that are also species names (such as "coli" or "major") stay upright. Subspecies may also follow "subsp.", "ssp." or "var.", which stay upright themselves, e.g., "K. pneumoniae subsp. ozaenae". Salmonella serovars (such as Typhimurium) and groups are not italicised, as is the convention. Punctuation around the names, such as brackets and commas, stays outside the italics.
The taxonomic names can be italicised using markdown (the default) by adding * before and after the taxonomic names, or <i> and </i> when using html. When using 'ansi', ANSI colours will be added using \033[3m before and \033[23m after the taxonomic names. If multiple ANSI colours are not available, no conversion will occur.
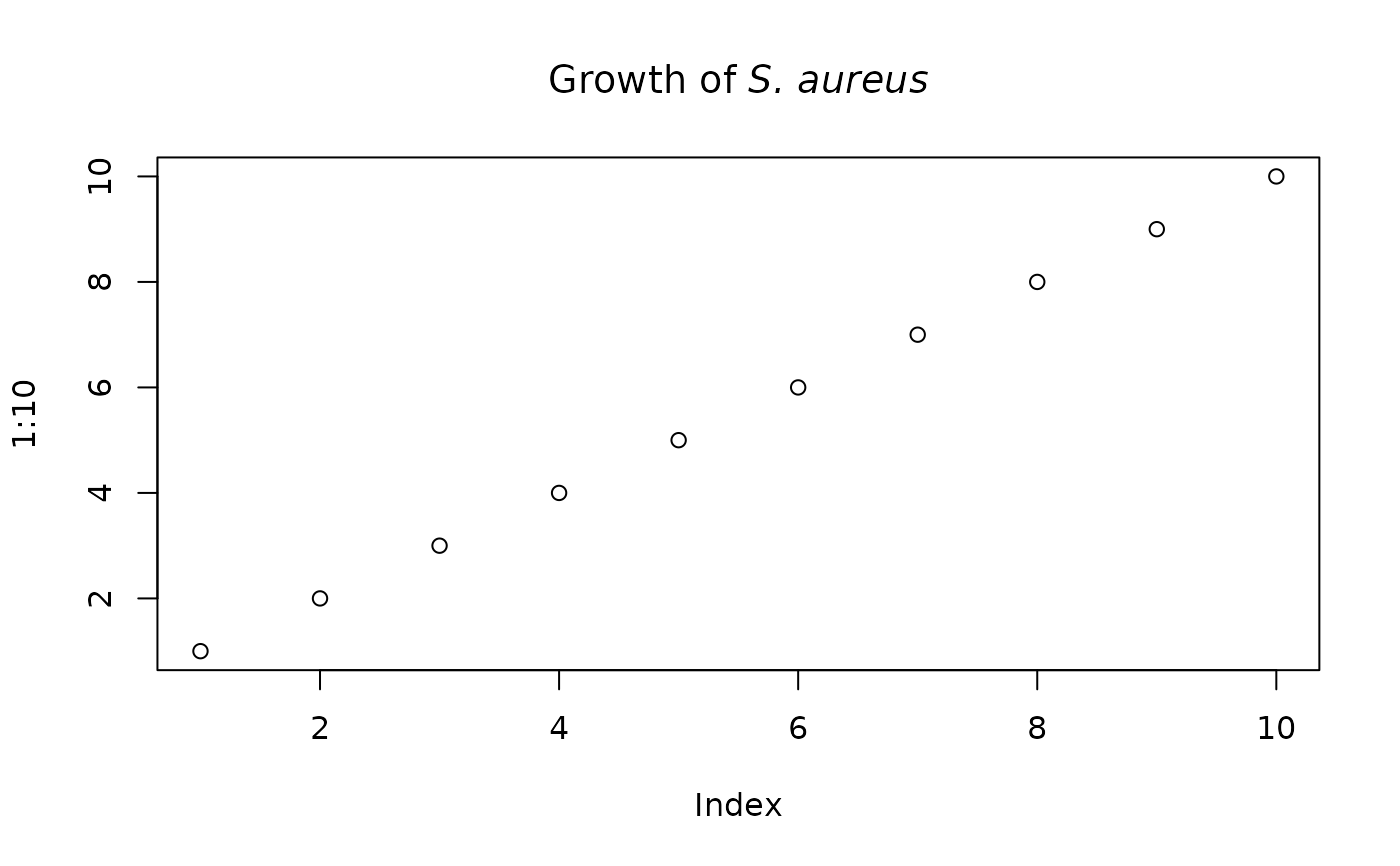
Use type = "plotmath" to get an expression vector for plots (see plotmath), which works for titles, axes and legends in both base R and ggplot2. For axis and legend labels, the function labels_taxonomy() does exactly this and can directly be used as labeller, e.g., ggplot2::scale_x_discrete(labels = labels_taxonomy).
See also
labels_taxonomy() to italicise taxonomic names in plot labels.
Examples
italicise_taxonomy("An overview of Staphylococcus aureus isolates")
#> [1] "An overview of *Staphylococcus aureus* isolates"
italicise_taxonomy("An overview of S. aureus isolates")
#> [1] "An overview of *S. aureus* isolates"
italicise_taxonomy("Infections with E. coli (and coli bacteria in general)")
#> [1] "Infections with *E. coli* (and coli bacteria in general)"

cat(italicise_taxonomy("An overview of S. aureus isolates", type = "ansi"))
#> An overview of S. aureus isolates

# for plots:
italicise_taxonomy("An overview of S. aureus isolates", type = "plotmath")
#> expression(paste("An overview of ", italic("S. aureus"), " isolates"))
plot(1:10, main = italicise_taxonomy("Growth of S. aureus", type = "plotmath"))